![Erin celebrates building the fleet community with 50 episodes and 11K followers on LinkedIn [Podcast]](https://intellishift.com/wp-content/uploads/2021/02/Digital-Transformation-_-Infographic.png "Episode 50 Thumbnail")
According to Gartner, “Leading organizations in every industry are wielding data and analytics as competitive weapons, operational accelerants and innovation catalysts.”
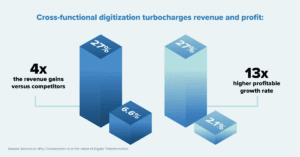
Likewise, the ultimate purpose of any fleet management system should be to create the visibility and data insights needed to drive better business results. Accenture lays this out clearly: the 22% of companies that successfully achieve cross-functional digitization saw 4x the revenue gains versus competitors (27% vs. 6.6%) and they saw profitable growth at a rate of 13x higher (27% vs 2.1% EBIT).
Fleet management vendors have been slow to provide what forward-thinking companies seek in a core tech solution. But a configurable fleet operations platform that provides end-to-end visibility – allowing for business intelligence – can get you there. Static spreadsheets and one-dimensional reporting will hold you back.
It’s clear that the time to make sure you have the fleet management solution is now. But to do so, we should first articulate the key factors that comprise the right solution for your enterprise needs.
The 5 Core Fleet Management System Components that Will Fuel Top-Tier Growth
1. Data accuracy: Can you count on your data?
Let’s get this one out of the way. It’s obvious. It’s table stakes. Why do we mention it? Sadly, we regularly hear from prospective clients that this remains an issue. You must be able to rely on our fleet management system to provide accurate data in real time. If your team regularly second guesses the validity of their data, it’s RFP time.
2. Ease of use: Are your employees using it to drive better business decisions?
In a recent survey of our customers, 98% said ease of use and/or implementation are important in a tech solution. When asked to list the two most important factors for tech, having access to real-time, non-siloed data and ease of use were the two most important. If a solution is not user-friendly, adoption of and value from a solution will be stunted.
How can you tell if a solution is easy to use? Pilot it with a few users.
3. Customer success: Do you have a vendor or a partner?
Perhaps the hardest to find but one of the most important key performance indicators is the relationship and customer experience you have with your vendor. Like any relationship (and it is a committed relationship from your perspective and should be from theirs as well), it takes communication, understanding and dedication.
A good tech partner won’t just “set it and forget it” or offer a rigid, out-of-the-box approach. Find a vendor that first takes the time to understand your operational processes, business goals and roadmap so that they can help configure their solution to your current and future needs. They should set up goals and dashboards that allow you to track progress toward those KPIs. And they should provide a designated Customer Success Manager that will be your go-to and that will keep the lines of communication open.
Here are a few questions to help evaluate current or future enterprise technology vendors:
- Do they take the time to understand your unique business and KPIs/metrics so that they can configure your solution to your business needs and operational processes?
- Do they help you set goals and metrics for how their solution will improve your operations, safety, compliance, productivity, cost savings, etc.?
- Do you have a designated contact at your vendor? How easy are they to get on the phone? How frequently do you meet with them?
- If you’re considering switching, ask about their installation process. Do they outsource this to you or a third party? Or do they take care of the installation themselves?
- Ask to see their project management plan for your installation. You want to achieve two things: minimal business disruption and fastest time to value. This can only be achieved with white glove installation/onboarding/project management by your vendor who is incentivized and accountable for a smooth installation.
- What are your customer retention rates?
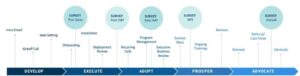
IntelliShift’s Customer Journey focuses on ongoing conversations, alignment and growth at every step of the customer relationship.
4. Configurability: Does the technology bend to your needs or require you to bend to it?
Today’s technology standard is to provide users with the ability to easily configure a solution to their specific needs. But not all technology providers – particularly in the fleet management world – have caught up to this standard.
What might this look like? Here are a few examples specific to fleet management:
- You only need one telematics solution for your fleet, whether that includes vehicles, powered and non-powered assets, heavy equipment, etc., because your platform is flexible enough to address all of your telematics needs.
- Your driver scorecards can adapt to your specific speeding thresholds and safety requirements.
- Your inspection forms are fully customizable to each vehicle or asset – or even better, you can create forms that require COVID health protocols before and after each shift.
- Reports and dashboards aggregate your cross-functional data sets for multi-dimensional data analysis.
Taking configurability further, an API is key to providing the ultimate visibility through seamless, bi-directional integration. If you’re able to push and pull key operational and other business data between your vital enterprise platforms (such as ERP, CRM, Finance and HR systems), you’ll be able to harvest new and meaningful data insights for informed decision making.
5. Business intelligence: Are your decisions data-driven and strategic or based on instinct and short-term need?
Gartner puts it plainly, “Data and analytics will become the centerpiece of enterprise strategy, focus and investment.” In a CIO.com article, Cindi Howson, research vice president at Gartner says, “If you’re only doing reporting you’re behind already. Unless your reporting is smart and agile, you’re behind. You’re a laggard.”
Unless an organization has the cross-functional visibility problem solved, real-time decisions at the manager level can easily be made (and often are) without real-time data. They can instead be based on a very real tactical need that actually costs more in the long run.
During a recent discussion with a prospective client, an executive from a utility tree removal company noted, “We never buy woodchippers.” The procurement rep responded, “What are you talking about? We buy one a day!”
“What are we doing with them after?”
“We sell them.”
“Why do we keep buying new ones?”
They were spending more than a million dollars a year on woodchippers because managers didn’t know what the company already owned. They had no real-time insight into overall operations and asset utilization across the business. These are the siloes that Accenture says is “hampering digital transformations and hindering the ability to drive growth in the post-digital world.”
If this is a familiar scenario for you, it’s time to find a new fleet management system that provide this basic, cross-functional visibility.
But a fleet management system should not stop at basic visibility for just resource management. Those 22% of companies that Accenture says are seeing meaningful revenue and profit growth versus competitors are those that have moved beyond this basic reporting. They are making strides using business intelligence built on cross-functional data integration and multi-dimensional analysis and dashboards.
To achieve this type of next-gen business intelligence, your fleet management system must provide the following:
- An end-to-end solution that includes more than just telematics but also modules that facilitate your safety and compliance programs, proactive vehicle service, fuel management, routing and more
- An API for bi-directional data integration between your enterprise operational systems
- Configurable, multi-dimensional dashboards that uncover insights using your cross-functional data, paving the way for the potential to see exponential revenue and profit growth versus your competitors
IntelliShift Will Help You Turn Siloed Data into Meaningful and Measurable Insights
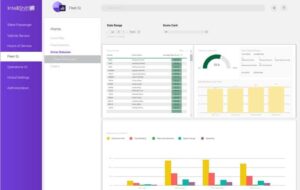
IntelliShift checks all these boxes. Our end-to-end solution breaks down your data siloes, providing one fleet management platform configured to your needs. Our multi-dimensional analytics dashboards will help you set goals and track and report on progress.
But perhaps the biggest factor in your success is finding a provider that partners in your success. That’s why we do two things differently:
- We partner with you at the outset and ongoing. Like any good relationship, we value communication, understanding and growth. Your designated customer success manager partners with you to ensure ongoing success.
- Offer white-glove project management and installation service via our in-house installation team and project management roadmap.
IntelliShift by the numbers:
- 3,000+ customers with a 98% customer retention rate
- Another client shared that they’ve seen $100,000 reduction in annual fleet maintenance per 100 vehicles from repair cost reduction by having real-time Diagnostic Trouble Code (DTC) alerts and real-time digital vehicle inspections.
- SCA shared that they’ve saved $475K annually in fleet maintenance and repair cost reduction. They’ve also been able to get overdue preventative maintenance instances down from 40%-50% to less than 3%.
Don’t know where to start? Talk to a Connected Operations expert.