![Erin celebrates building the fleet community with 50 episodes and 11K followers on LinkedIn [Podcast]](https://intellishift.com/wp-content/uploads/2025/06/gfx-blog_fleet-safety-scorecards.png "Episode 50 Thumbnail")
Fleet safety shouldn’t be a guessing game. But let’s face it—sometimes it is. Managers often rely on gut feelings, hope their policies are enough, and just try to avoid the next big accident.
Fleet safety isn’t just about avoiding expenses. It’s about protecting lives. One serious accident can change everything for a driver, a team, and a business. And yes, the financial cost is real, too. On average, a single fleet accident runs $75,000, and that climbs fast when injuries are involved.
Because behind every stat is a real person. And behind every preventable incident is a missed opportunity to do better.
That’s where driver scorecards help. They track risky driving behaviors and turn them into clear, simple scores your team can understand and act on. They make safety expectations clear, coaching easier, and progress easier to see.
In short, scorecards help your safety program stay focused on every mile and every driver.
How Fleet Safety Scorecards Work
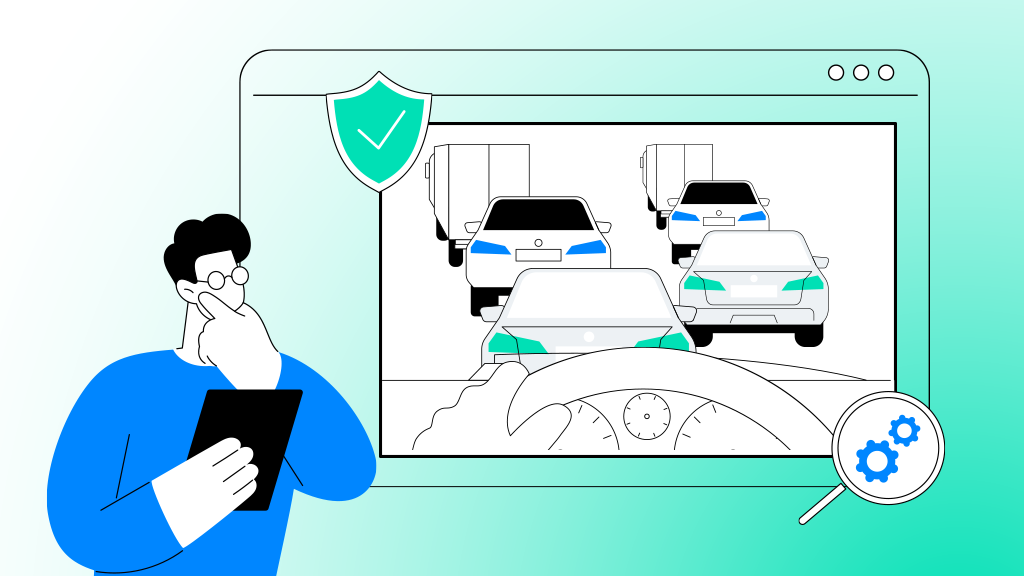
A fleet safety scorecard takes driving data and turns it into a simple score you can use to improve safety and driver performance.
It surfaces key driving behaviors in real time, organizes the data, and shows you who’s driving safely—and who might be creating risk for your team and your business.
What does a scorecard track? The driving habits that matter most for safety, efficiency, and reducing risk.
The real power of a scorecard isn’t just the data, but in how it’s set up. A good scorecard sets clear expectations for everyone on the team. It shows what safe driving looks like. And if a driver’s score starts to drop, you can spot the problem early and take action before it leads to an accident.

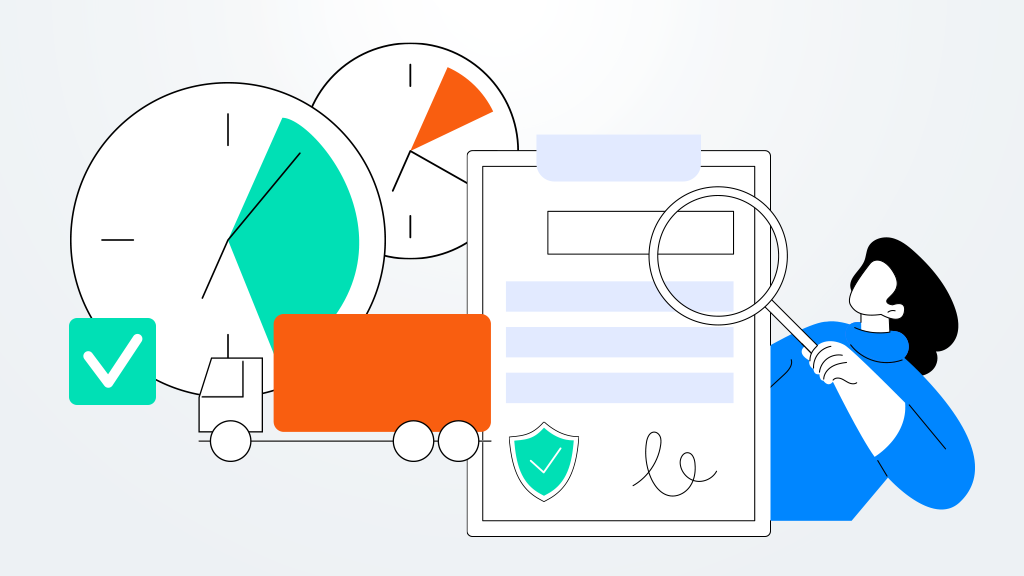
Choosing the Right Metrics for Your Fleet Safety Scorecard
Not all driving violations are equal. That’s why scorecards give more weight to some actions than others. For example, distracted driving or not wearing a seatbelt is much riskier than things like idling or speeding up too fast. A good scorecard takes this into account and gives higher scores to the behaviors that matter most for safety.
Sample Weighted Fleet Safety Scorecard Table
| Behavior Tracked | Risk Level | Weight (%) |
|---|---|---|
| Distracted Driving | Critical Risk | 30% |
| Harsh Braking | High Risk | 20% |
| Speeding | High Risk | 20% |
| Seatbelt Usage | Non-Negotiable | 10% |
| Following Distance | Moderate Risk | 10% |
| Idling | Low Risk | 5% |