Table Of Content
You can open your telematics platform right now and find every vehicle you own. Green dot on the map, moving north on I-70, doing 58 mph.
Here is the uncomfortable part. That dot tells you almost nothing about whether the truck is earning its keep.
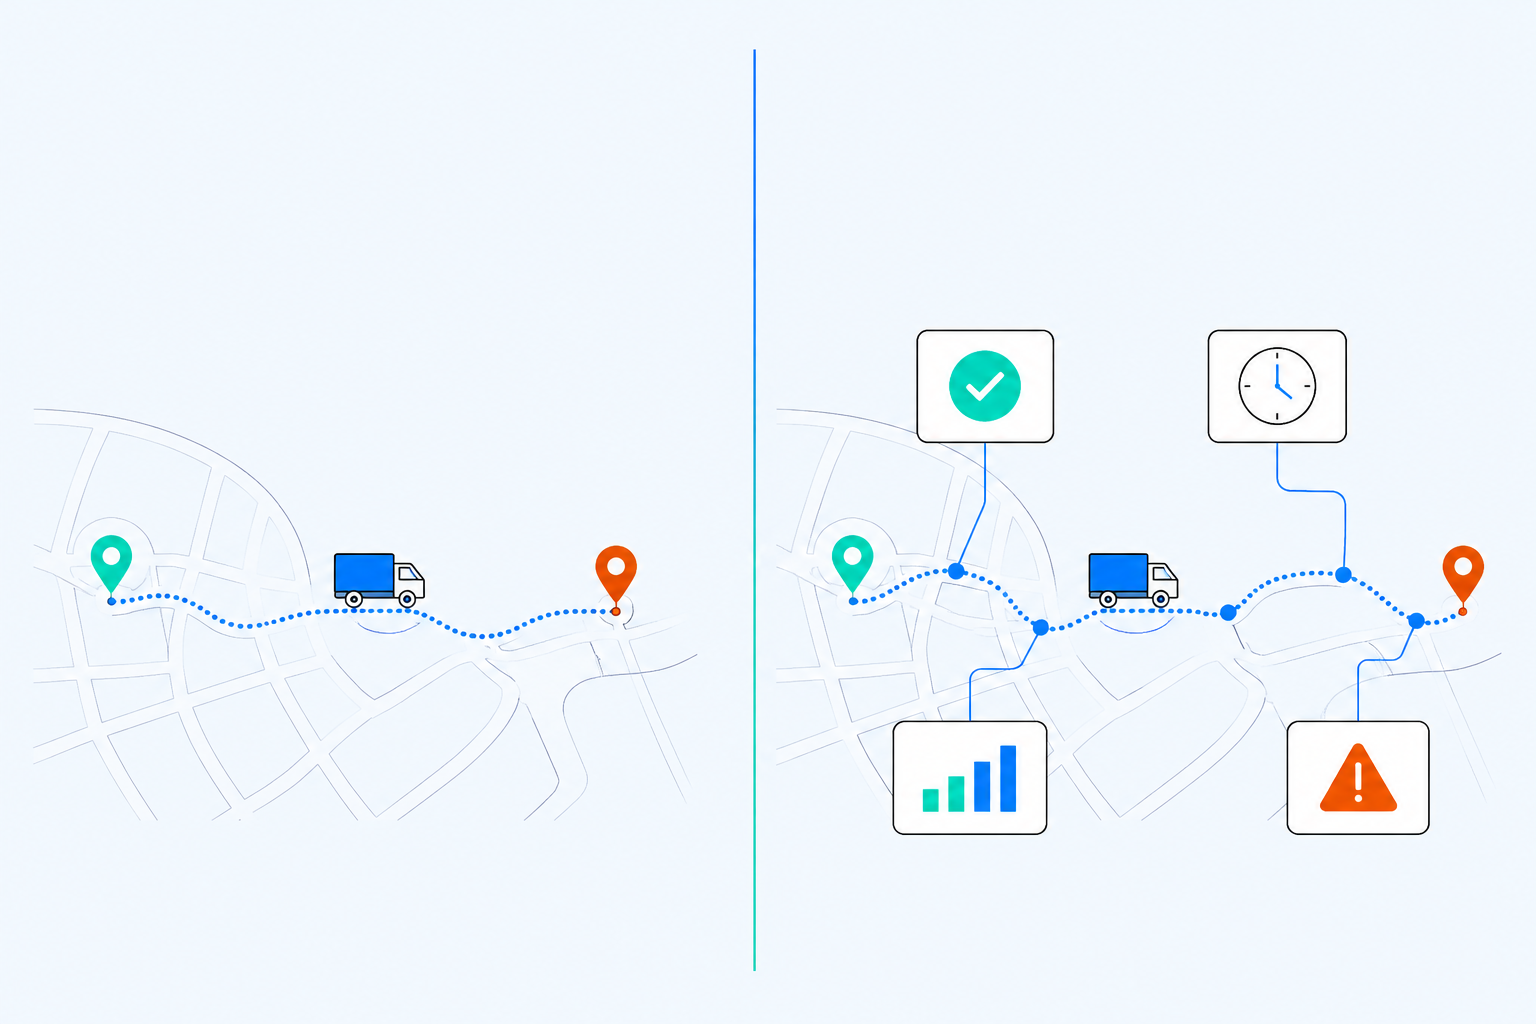
It does not tell you whether the crew inside finished the job or has to come back Thursday. It does not tell you that the truck sat for two hours at a customer site because the gate code was wrong. It does not tell you that the same route was covered by two vehicles when one would have done. Location data answers where. Fleet productivity is a question about what got done, at what cost, and whether it was worth doing that way.
Most fleets have plenty of vehicle data. What they usually lack is the connection between that data and the work the business actually sells. This guide walks through the fleet productivity KPIs that close that gap, how to calculate them, what data you need, and, just as important, how each one can lie to you if you read it by itself.
What Is Fleet Productivity?
Fleet productivity is a measure of how effectively your vehicles, equipment, drivers, and hours convert into completed business work.
That is the whole definition. Notice what is not in it: miles, hours, or movement. A fleet that drove 400,000 miles last quarter has told you about activity. A fleet that completed 9,400 service calls at an average cost of $118 each has told you about productivity.
The distinction matters because activity is easy to measure and productivity is not. Activity comes free with a GPS device. Productivity requires you to connect vehicle data to job data, and job data usually lives in a different system owned by a different department.
Fleet Productivity vs. Fleet Efficiency: What Is the Difference?
Fleet efficiency measures how little input you use. Fleet productivity measures how much useful output you get.
They are related, but they are not the same, and confusing them causes real damage. A fleet can be highly efficient and quietly unproductive. Picture a service fleet with excellent fuel economy, near-zero idle time, and low maintenance spend, where technicians are only completing four jobs a day because dispatch is routing them badly. Every efficiency metric looks great. The business is still leaving money on the table.
Run both. Efficiency metrics tell you whether you are wasting resources. Productivity metrics tell you whether the resources you are using are producing anything.
Why GPS Tracking Alone Cannot Measure Productivity
GPS tracking answers where a vehicle is and how it got there. It cannot answer whether that trip produced value, because location data has no idea what the trip was for.
There are three specific gaps:
Gap 01
No job context
Telematics knows the vehicle stopped for 47 minutes at a set of coordinates. It does not know whether that was a scheduled two-hour install that finished early, an unscheduled callback, or lunch.
Gap 02
No outcome
A completed stop and a failed stop look identical on a breadcrumb trail. The truck arrived. The truck left. Whether the customer's problem got solved lives in a work order system.
Gap 03
No cost or revenue
Miles are not dollars. Two vehicles can drive the same route at the same speed and cost the business wildly different amounts once you account for asset class, labor, fuel, and maintenance.
This is not an argument against telematics. Telematics is the foundation, and every KPI below depends on it. The point is that GPS data becomes a fleet performance metric only when it is joined to something else: a work order, a billing record, a job code, an inspection, or a maintenance event.
That joining step is where most fleet productivity programs stall out.
How Is Fleet Productivity Measured?
Fleet productivity is measured by defining a unit of work, measuring your available capacity to perform that work, and then tracking three things: how much work got done, what it cost, and whether it was done correctly.
There is no single fleet productivity number, and you should be skeptical of any vendor or consultant who offers you one. Productivity is a small set of metrics read together.
Start with three questions. Every good fleet KPI answers one of them.
A fleet that only tracks the first column will push its people until something breaks. A fleet that only tracks the second will cut its way into unreliability. You need all three.

Define Your Unit of Work First
Before you calculate anything, decide what a “job” is for your operation. This sounds obvious. It is the single most common reason fleet KPI programs produce numbers nobody trusts.
Field services and utilities: a service call, work order, or ticket
Construction: a task, pour, lift, or equipment-hour on an active job site
Last-mile delivery: a stop, package, or completed route
Ready mix and bulk: a delivered load or cubic yard
Pick one, write it down, and make sure dispatch, operations, and finance all agree on it. If your ops team counts a “job” and your billing team counts a “line item,” your cost-per-job metric will be fiction.
The Fleet Productivity KPIs That Matter Most
Here is the working set. For each one: what it measures, why it matters, how to calculate it, the data you need, what it reveals, and where it can mislead you.
A quick reference table first, then the detail.
Jobs Completed per Vehicle per Day
What it measures: Raw throughput. How many units of work a single vehicle contributes in a working day.
Why it matters: It is the closest thing to a top-line productivity number, and it is the metric your leadership team will understand without a translator.
How to calculate it:
Count only vehicles that were actually available. A truck in the shop for three of five days should count as two days of capacity, not five, or you will punish yourself for maintenance you needed to do.
Data you need: Completed job records from your work order, dispatch, or field service system, plus vehicle-in-service days from telematics and your maintenance records.
What it reveals: Big swings between branches, regions, or crews usually point at something structural, like routing, territory density, job mix, or dispatch discipline. A branch running 20% below its peers is rarely staffed with worse people. It is usually working a harder geography or a broken schedule.
Where it misleads: This is the metric most likely to be gamed, and the one where “higher is better” fails hardest. More jobs per day can mean better routing and tighter dispatch. It can also mean crews are rushing, skipping steps, or cherry-picking the easy tickets and pushing the hard ones down the queue. It can also just mean the job mix got simpler this month. Never report jobs per day without first-time completion rate sitting next to it.
First-Time Completion Rate (First-Time Fix Rate)
What it measures: The share of jobs finished correctly on the first visit, with no return trip required.
Why it matters: A repeat visit is a job you paid for twice and got paid for once. It consumes a truck, a driver, fuel, and a slot on the schedule that a revenue-generating job could have filled. The scale of the waste is well documented. Aquant’s 2026 benchmark of 161 service organizations, covering nearly 30 million service events and $8.3 billion in service costs over three years, found the industry first-time fix benchmark sits at 77%, with top performers reaching 88% and bottom performers at 60%. More striking: failed visits account for 25% of total service cost at the median, and for bottom performers they consume nearly half of it, 44%, compared to 14% for top performers. The same research found that one in five cases could have been resolved remotely without rolling a truck at all.
That research covers field service across manufacturing, medical devices, and industrial equipment rather than fleets specifically, so treat the percentages as directional. The structural lesson holds for any fleet that dispatches vehicles to complete work: the return trip is usually the largest recoverable cost in the operation, and it does not appear as a line item anywhere.
How to calculate it:
Definitions vary by organization, and that is legitimate. Some fleets exclude jobs where a return was scheduled at the customer’s request. Some exclude multi-phase installations by design. Whatever you decide, document the rule and apply it consistently, because this metric is nearly useless for benchmarking if the definition drifts.
Data you need: Work order records with visit sequencing, plus a reliable way to link a return visit to the original job.
What it reveals: Low first-time completion is almost never a technician problem. It is usually a parts availability problem, a diagnosis problem, a scheduling problem, or a job-scoping problem. The metric points upstream.
Where it misleads: A fleet can raise its first-time completion rate by taking longer on every job and by only sending senior people to hard work. Both improve the number and hurt throughput. Read it against jobs per day and average job duration.
Time on Site vs. Time in Transit
What it measures: How the working day actually splits between productive work at the customer or job site, travel between locations, and everything else.
Why it matters: This is the single most revealing fleet productivity metric most fleets are not tracking, because it exposes where the day disappears to. Every hour in transit is an hour of cost with no output attached.
How to calculate it:
Then break the remainder into transit, waiting, and administrative time. The absolute number is less useful than the trend and the variation between crews.
Data you need: Geofences around customer sites, yards, and job sites, plus telematics arrival and departure timestamps, and ideally ELD duty status to bound the working day. This is exactly the approach federal researchers use: FMCSA’s ongoing detention time study collects arrival and departure information using GPS data and geofenced facility data.
What it reveals: Whether your productivity problem is a routing problem or a job-site problem. Two fleets with identical jobs-per-day numbers can have completely different day structures, and the fix for each is different. High transit means look at territories, dispatch sequencing, and where you stage equipment. High on-site time that is not producing more completed jobs means look at what crews are waiting on when they get there.
Where it misleads: On-site time is not automatically productive time. Waiting at a customer facility looks identical to working at a customer facility in a GPS trail. This is a real and expensive problem, not a theoretical one. FMCSA notes there is currently no standard definition of detention time, and that industry, government, and academic researchers have generally used dwell time exceeding two hours as the threshold at which normal loading or working time becomes detention. Set your own threshold based on your job types, and treat time beyond it as a separate category rather than lumping it in with productive work.
Vehicle and Asset Utilization Rate
What it measures: How much of an asset’s available capacity you are actually using.
Why it matters: Underutilized assets are the quietest expense in a fleet. They do not break, they do not speed, and they do not show up in an incident report. They just sit there depreciating, insured and registered, while somebody in another branch is renting the same equipment because they did not know it was available.
How to calculate it: The commonly used form is straightforward:
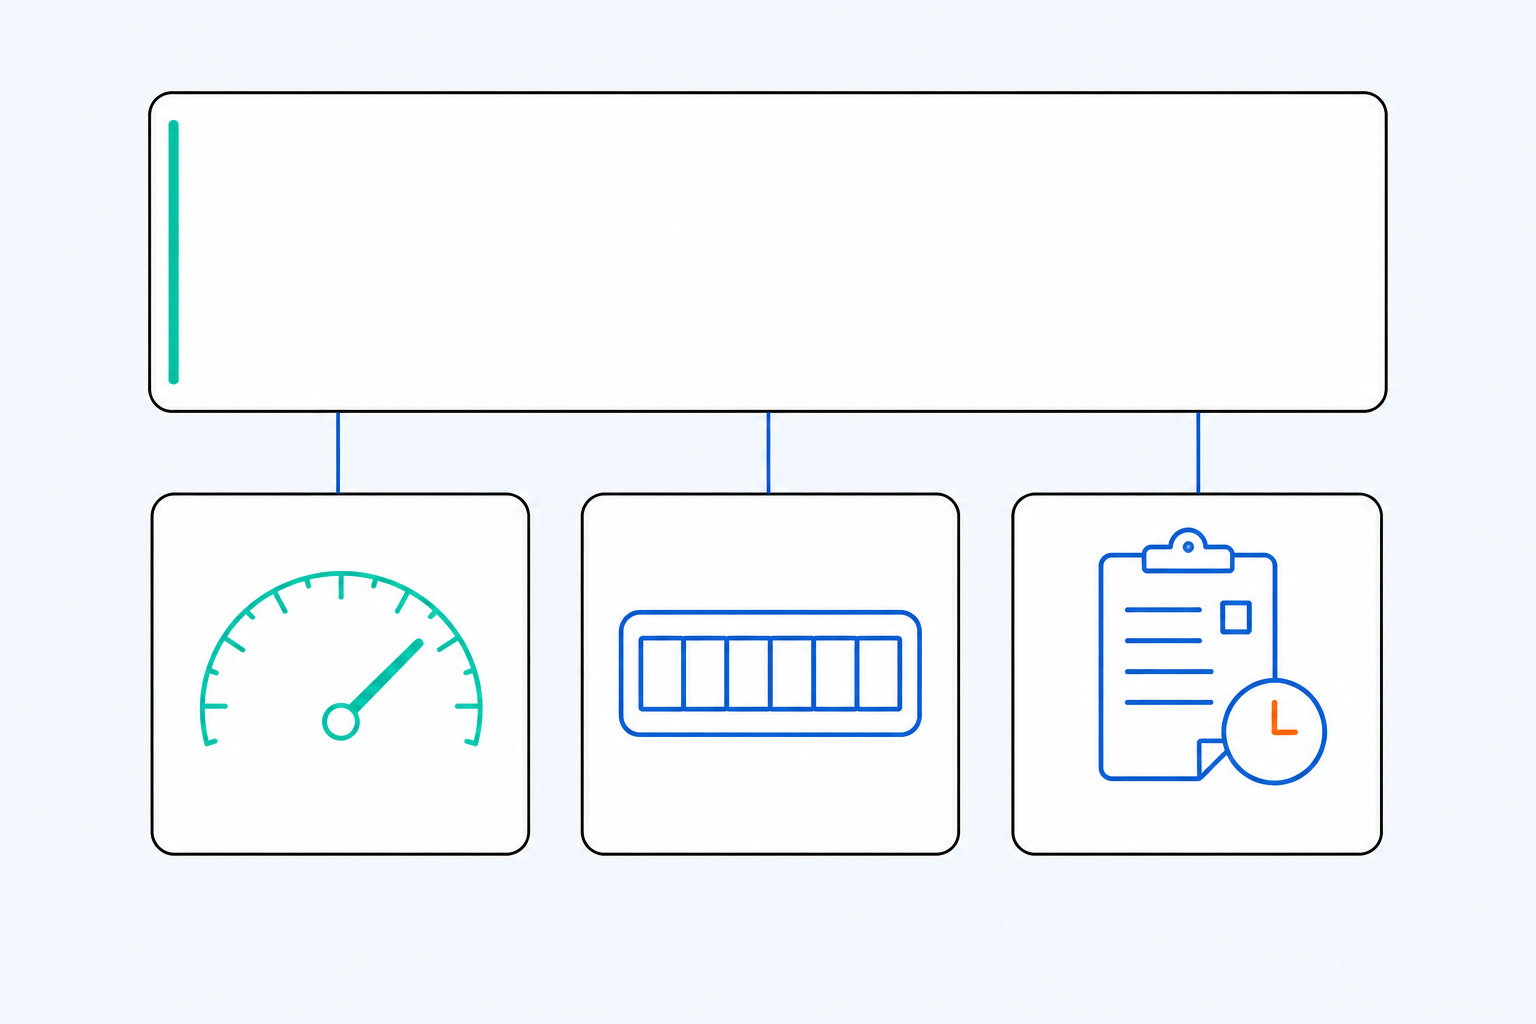
Organizations calculate this differently, and there is no single accepted industry standard, so choose your denominator deliberately:
Engine hours or PTO hours for equipment and vocational assets, where the work happens while stationary
Miles or days in use for on-road vehicles that move to produce value
Billable hours where you invoice by the hour and can tie asset time to a job code
Federal fleet guidance illustrates both the usefulness and the limits of a mileage-based approach. GSA sets utilization thresholds of 12,000 miles per year for passenger-carrying vehicles and 7,500 miles per year for heavy trucks over 24,000 lbs. GVWR. But the same regulation states plainly that utilization guidelines for other trucks and special purpose vehicles have not been established, and it allows other factors, including days used, mission, and the relative cost of alternatives, to justify a vehicle where the mileage guidelines are not met. Those thresholds date to the early 1990s and are not a modern benchmark, so do not hold your fleet against them. The useful part is the exception: even federal regulators concede that for a bucket truck, a boom lift, or a vac truck, miles driven is a poor proxy for work performed.
Data you need: Telematics with engine hour and, where available, PTO or sensor data. Non-powered assets need a tracking device that reports movement or location. IntelliShift supports both powered and non-powered assets, including solar and satellite-powered tracking, which matters if a meaningful share of your equipment has no battery to draw from.
What it reveals: Right-sizing opportunities and redeployment opportunities. Federal fleet guidance recommends this exact process, called a vehicle allocation methodology, to determine the appropriate size and number of vehicles and identify opportunities to eliminate unnecessary ones, with agencies advised to repeat the analysis at least every five years. The private-sector version is the same discipline: know how each asset is used before you decide how many you need.
Where it misleads: Two big traps. First, a low utilization rate is not automatically bad. Some assets exist for surge capacity, emergency response, or storm work, and their value is in being available, not in being busy. Judge those against a different standard. Second, high utilization is not automatically good. An asset running at 95% has no slack, which means a single breakdown cascades straight into missed jobs. Utilization and vehicle availability need to be read together.
Idle Time and Productive vs. Nonproductive Engine Hours
What it measures: Engine hours where the vehicle is running but not moving, split into idle that is doing work and idle that is not.
Why it matters: The waste is enormous in aggregate. Argonne National Laboratory estimates that U.S. passenger vehicles, light trucks, medium-duty trucks, and heavy-duty vehicles burn more than 6 billion gallons of fuel a year without moving, with roughly half of that coming from medium- and heavy-duty vehicles. Idle time also accrues engine hours, which pulls maintenance intervals forward and shortens asset life, so the fuel bill is only part of it.
How to calculate it:
Data you need: Engine diagnostic data through telematics. If you want to separate productive from nonproductive idle, you also need PTO status, geofence context, or job-code context.
What it reveals: Where policy is not landing. Idle percentage varies enormously by branch, by shift, and by season, and the variation usually reflects local supervision and habit more than anything else.
Where it misleads: This is where a lot of fleets get idle policy badly wrong. Not all idle is waste. Argonne specifically notes that medium-duty trucks idle to support power take-off for utility equipment such as lift buckets, pumps, or lighting used by crews in the air or underground. Idling to run a bucket is production. Idling to keep the cab cool during a legally required break is a driver welfare decision, and in extreme heat or cold it is a reasonable one. If you set a blanket idle target without separating PTO idle and duty-required idle from discretionary idle, you will penalize your best crews for doing their jobs and you will lose the room’s trust on every metric you introduce afterward.
Split the number into three buckets before you set a target: PTO or work idle, required idle, and discretionary idle. Only the third one is the problem.
Fleet Cost per Job or Service Call
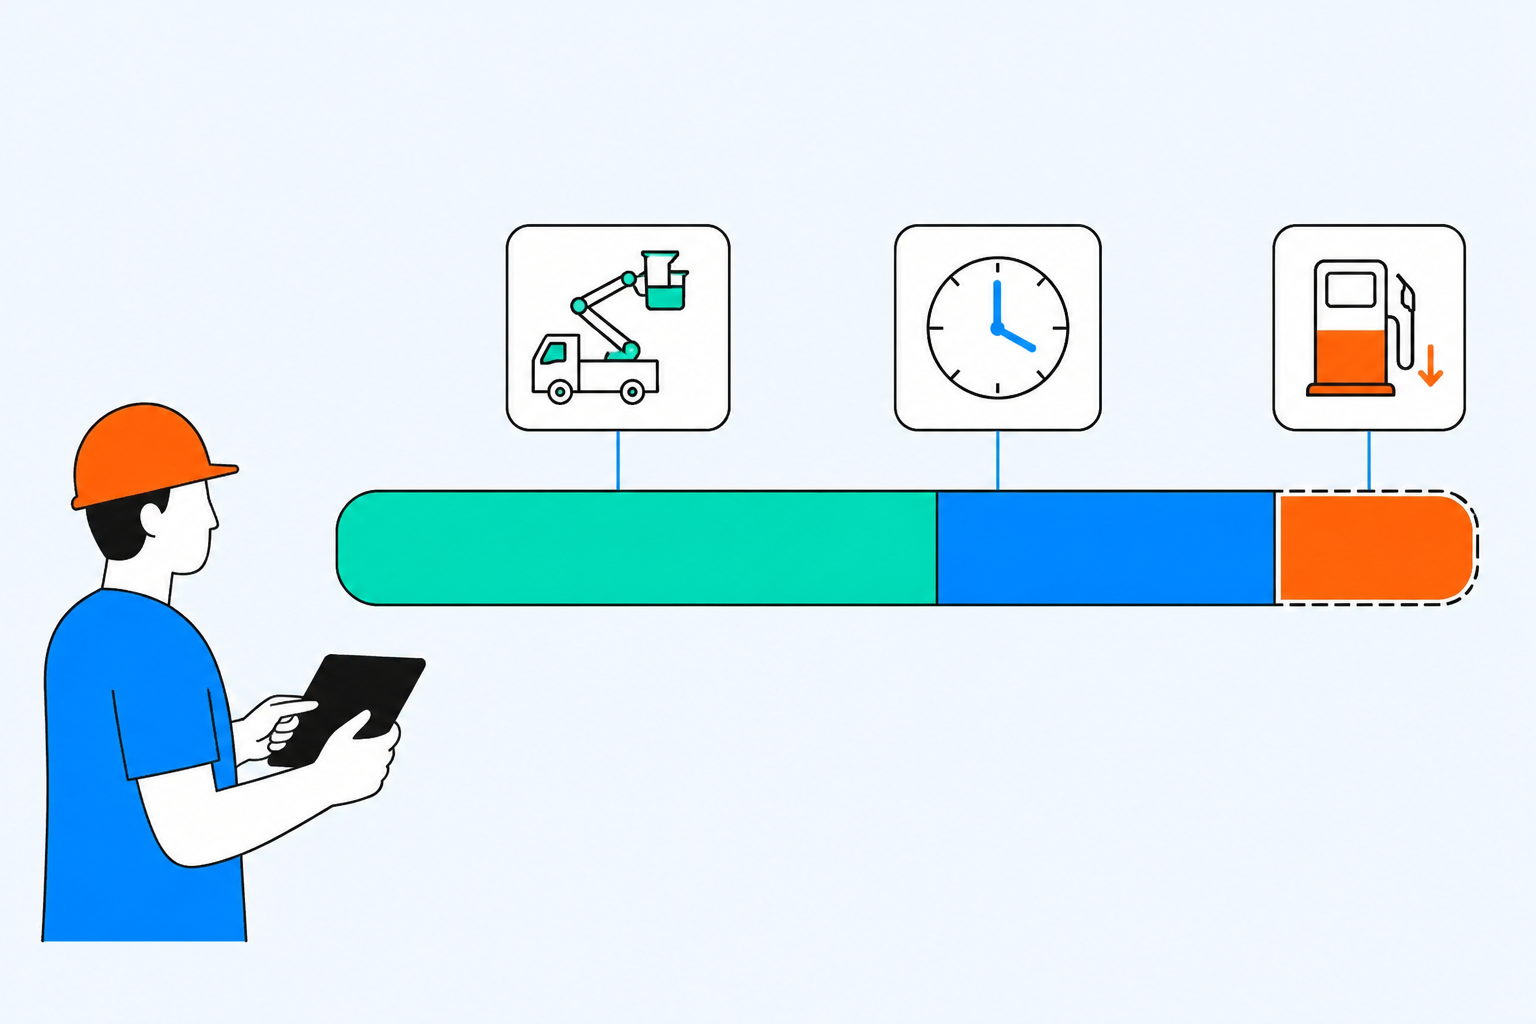
What it measures: The all-in fleet cost of delivering one unit of work.
Why it matters: It is the metric that translates fleet performance into language finance already speaks, and it is the one that survives contact with a budget meeting. It also normalizes for volume, which raw cost totals do not.
How to calculate it:
Decide up front what goes into “total fleet operating cost.” At minimum: fuel, maintenance and repair, tires, insurance, and depreciation or lease payments. Many fleets also include driver wages and benefits, which usually makes it the largest component. There is no universal standard here, so the rule is to be explicit and consistent. A cost-per-job number is only useful compared to itself over time or across branches using the same formula.
Data you need: Fuel transactions, maintenance and work order costs, payroll or labor hours, asset cost data, and a job count you trust.
What it reveals: Whether growth is actually profitable. Cost per job that climbs while volume climbs means you are scaling something inefficient.
Where it misleads: Cost per job is sensitive to job mix, and job mix changes constantly. A quarter heavy on small, quick calls will show a lower cost per job than a quarter heavy on complex installs, and neither reflects a change in how well the fleet is being run. Segment by job type before you draw conclusions. For context on cost direction, ATRI’s benchmarking of over-the-road carriers found the industry-average cost to operate a truck reached $2.336 per mile in 2025, up 3.4% year over year, with repair and maintenance among the largest increases at 8.6%. Vocational and field-service fleets have a different cost structure than long-haul carriers, so treat that as a directional signal rather than a benchmark to hold yourself against.
Revenue per Vehicle or per Asset Hour
What it measures: The revenue the business generates relative to the fleet resources used to generate it.
Why it matters: Cost per job tells you what you spent. Revenue per vehicle tells you what the spending produced. Together they are the closest a fleet leader gets to a profitability view of the fleet.
How to calculate it:
Revenue per Asset Hour = Revenue Attributable to the Asset ÷ Productive Asset Hours
The second version is more useful for mixed fleets and for equipment, because it does not treat a $40,000 pickup and a $400,000 crane truck as equivalent units.
Data you need: Billing or ERP revenue data tagged to jobs, plus job-to-asset assignment, plus asset hours from telematics. This is the KPI that most requires an integration between fleet data and back-office systems, which is precisely why so few fleets track it.
What it reveals: Which asset classes and which branches actually earn. It is also the strongest argument you will ever have in a capital request conversation, because it reframes a vehicle purchase as a revenue capacity decision instead of a cost.
Where it misleads: Attribution is genuinely hard. Revenue on a job usually depends on sales, estimating, materials, and labor as much as on the vehicle, and assigning all of it to an asset overstates the fleet’s contribution. Use it to compare like assets against like assets over time. Do not use it to declare that one truck “made” $180,000.
Vehicle Availability and Maintenance-Related Downtime
What it measures: The share of time an asset was ready to work, and how much of the unavailable time was unplanned.
Why it matters: Availability is the ceiling on every other productivity metric. You cannot complete jobs with a truck that is in the shop, and unplanned downtime is far more expensive than planned downtime because it takes the schedule with it. A vehicle that fails on Tuesday morning does not just cost a repair. It costs the day’s jobs, the reschedule, the customer conversation, and often a rental.
How to calculate it:
Unplanned Downtime Share = Unplanned Downtime Hours ÷ Total Downtime Hours × 100
That second ratio is the one worth watching. Total downtime going up is not necessarily bad news if the increase is planned preventive work. Unplanned downtime going up is always bad news.
Data you need: Maintenance and work order records with planned versus unplanned classification, inspection results, engine fault codes, and asset in-service dates.
What it reveals: Whether your maintenance program is running the fleet or reacting to it. A rising ratio of unplanned to planned downtime is an early warning that PM intervals, inspection quality, or parts availability have slipped, and it typically shows up months before it shows up in cost per job.
Where it misleads: Chasing maximum availability by deferring maintenance works right up until it does not. Fleets that cut planned downtime to hit an availability target usually pay for it two quarters later with a spike in roadside failures. Pair availability with the unplanned downtime ratio and with your inspection defect rate, and be honest about which direction each is moving.
Driver and Operator Productivity
What it measures: The output an individual driver or operator produces relative to the productive hours available to them.
Why it matters: Variation between people is usually larger than variation between vehicles, and it is coachable. Understanding what your top performers do differently is more valuable than any equipment decision you will make this year.
How to calculate it:
Productive hours means on-duty hours minus required breaks, and ideally minus documented waiting time that was outside the driver’s control. If you do not make that adjustment, you are scoring people on their dispatcher’s decisions and their customers’ gate procedures.
Data you need: ELD or timekeeping data for hours, work order completions for output, and geofence or job-code context to separate controllable from uncontrollable time.
What it reveals: Coaching opportunities, training gaps, and, frequently, dispatch bias. It is common to discover that the “low performing” driver is being assigned the worst territory.
Where it misleads: This is the KPI with the highest potential to do damage, and it needs the most care. Ranking drivers on output alone creates pressure to speed, skip inspections, and rush jobs. That is not a hypothetical concern. In public comments to FMCSA on its detention time study, respondents described how drivers who lose time waiting may be inclined to drive aggressively or above the speed limit to stay within hours-of-service limits and reach their next appointment. The productivity pressure was real, and the response was risk.
Never publish a driver productivity ranking without safety performance alongside it. A driver who completes 12% more jobs while generating three times the harsh-braking events is not your best performer. They are your next claim.
How to Read Fleet KPIs Together (This Is the Part That Matters)
No fleet KPI means anything by itself. Every metric on the list above can be improved in a way that harms the business, and most of them can be improved without anyone intending to game anything.
The discipline is to always read metrics in pairs, where one metric measures output and the other measures the cost of that output in quality, risk, or asset life.
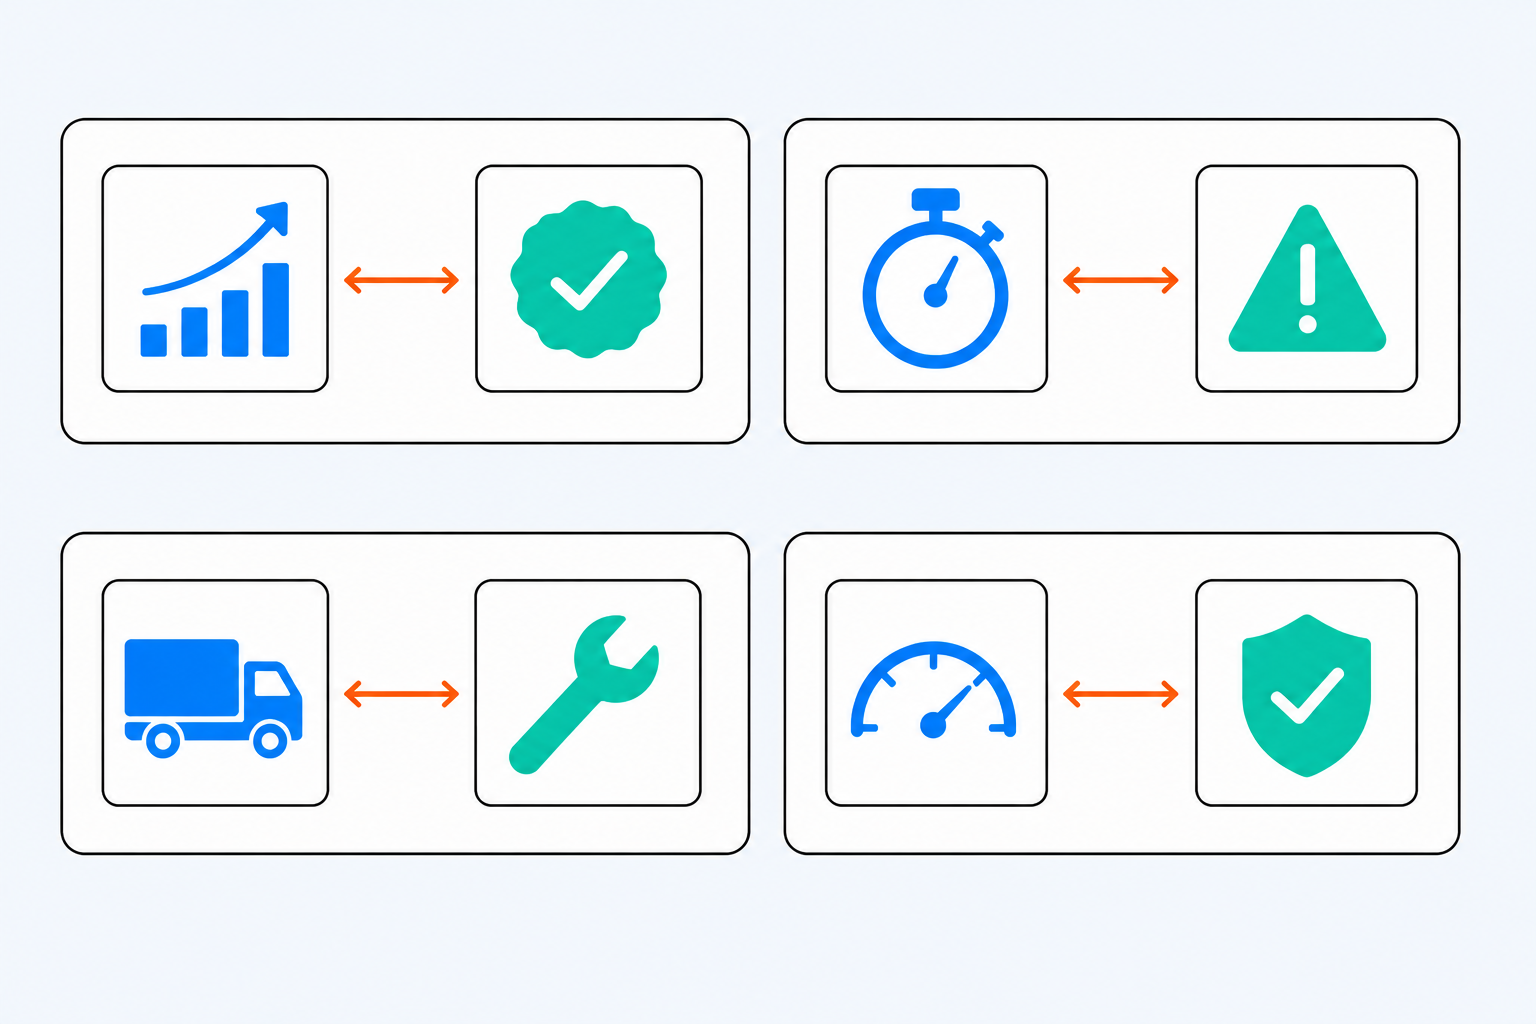
The manufacturing world solved this problem decades ago with overall equipment effectiveness, which refuses to score a machine on speed alone and instead multiplies availability, performance, and quality together. A machine running fast while producing scrap scores badly, by design. Fleet leaders can borrow the logic without borrowing the formula: if a productivity gain does not survive a quality and safety check, it is not a gain. It is a loan.
A Worked Example
Say a regional branch reports the following month-over-month:
Jobs per vehicle per day: up 11%
Miles per vehicle: flat
First-time completion rate: down from 81% to 74%
Harsh-braking events per 1,000 miles: up 22%
Cost per job: down 4%
Read the first, second, and fifth lines alone and this is a great month. Throughput is up, the fleet is not driving further to get it, and unit cost is down. Somebody gets a commendation.
Read all five and a different story appears. Seven points of first-time completion translate into a wave of return visits that will land next month, consuming capacity that is already booked. The harsh-braking spike says the throughput is partly coming from driving harder. The cost per job improvement is temporary, because the cost of those return trips has not been booked yet.
Same fleet. Same data. The only difference is which metrics were allowed in the room.
Which Metrics Belong on a Fleet Productivity Dashboard?
A fleet productivity dashboard should show output, cost, and quality side by side, at a cadence matched to who is looking at it. The most common dashboard mistake is showing everyone the same 30 tiles.
Two rules that will save you a lot of grief:
Every tile needs an owner and an action. If nobody's job changes based on a number, take it off the dashboard. It is decoration.
Show trend, not just value. A 78% first-time completion rate means nothing without knowing whether it was 71% or 85% last quarter.
How Connected Fleet Data Makes These Metrics Possible
Here is the honest constraint. Almost every KPI in this article requires data from at least two systems, and several require three or four. Cost per job needs fuel data, maintenance data, labor data, and job data. Asset utilization needs engine hours and job context. Time on site needs geofences, telematics, and duty status.
When those systems do not talk, the work of producing a fleet productivity number falls to whoever is best at spreadsheets, and it happens monthly at best. By the time the report lands, the month it describes is over.
This is the problem IntelliShift was built to solve. The platform brings fleet telematics, AI Dash Cams, digital inspections, maintenance, fuel management, and compliance into one system, so the data that answers a productivity question is already in the same place.
A few things matter specifically for the metrics in this article:
Combining datasets that normally live apart. IntelliShift's fleet analytics includes a drag-and-drop report builder with more than 50 widgets and dimensions, plus more than 50 pre-built dashboards covering asset utilization, diagnostics, fuel usage, speed, and safety. It is designed to let you put vehicle performance next to safety data, or asset utilization next to maintenance data, without exporting anything.
Connecting fleet data to the rest of the business. The platform integrates with back-office systems including payroll, project management, field service, jobsite budgeting, and HR. That integration is what makes cost per job and revenue per asset hour achievable rather than theoretical, since those metrics depend on data the fleet system does not own.
Utilization across mixed fleets. Asset tracking covers powered and non-powered equipment, including solar and satellite-powered tracking, with utilization reporting that shows how, when, and where assets are used. For construction and utility fleets where a meaningful share of the asset base is trailers, generators, and attachments, that is the difference between a real utilization number and a partial one.
Peer context. IntelliShift's benchmarking feature aggregates anonymized data across its customer base to produce industry benchmarks for KPIs including fuel efficiency, driver behavior, and vehicle utilization, so fleets can see how their numbers compare rather than guessing.
Verification for billing. Geofences and alerts confirm that people and equipment were where they were supposed to be, when they were supposed to be there. One construction customer put it plainly: their maintenance projects bill by the hour, and IntelliShift works as verification when someone questions hours worked versus hours billed.
Where AI Dash Cams Fit Into Productivity
AI Dash Cams tend to get filed under safety, and that undersells what they contribute to a productivity conversation.
The AI Dash Cams available through IntelliShift analyze 100% of drive time and filter out noise with up to 99% accuracy, detecting more than 40 unsafe behaviors including speeding, distracted driving, following too closely, seat belt violations, harsh braking, and hard cornering. They are dual-facing by design, capturing both the roadway and the cab. Real-time in-cab alerts give drivers a chance to self-correct in the moment rather than hearing about it in a meeting three weeks later.
Two things make that productivity-relevant rather than just safety-relevant.
First, context. Video clips of safety events sit in the IntelliShift platform alongside telematics, compliance, and maintenance data. When a productivity metric moves in a direction you did not expect, context is what turns a number into a decision. A spike in harsh braking on one route is a data point. A spike in harsh braking on one route with video showing a poorly marked construction detour is a routing change.
Second, fairness in scoring. IntelliShift’s GreenZone® score groups drivers for comparison and turns dash cam behavior plus telematics signals into a single comparable number per driver, and drivers can see their own score in a mobile app. That matters because driver productivity metrics only change behavior if drivers believe the scoring is fair. A system that measures behavior against actual exposure, rather than counting events in isolation, is far easier to coach with.
The framing to avoid is the surveillance framing. Fleets that roll out cameras as a monitoring tool get resistance and turnover. Fleets that roll them out as protection and coaching get adoption, and adoption is what makes any of the downstream data worth measuring.
Where to Start
If you are building this from scratch, resist the urge to instrument everything at once.
1.Define your unit of work and get dispatch, operations, and finance to agree on it in writing.
2.Pick three KPIs, one from each column of the output-cost-quality framework. Jobs per vehicle per day, cost per job, and first-time completion rate is a strong starting trio for most field-service and utility fleets.
3.Find out where each input actually lives and how current it is. This step usually takes longer than expected and is where you will discover which integrations you need.
4.Baseline for a full quarter before setting any targets. Seasonality will make a fool of anyone who baselines in one month.
5.Publish the pairs, not the singles. From the first report onward, never show an output metric without its quality counterpart. Set that expectation early and it becomes the norm.
If you want a head start, our ten plays the most productive fleet managers use covers the operational side of this in more depth.
Fleet Productivity Is Not About Doing More
The instinct when leadership asks about fleet productivity is to squeeze. More stops per route. Tighter windows. Lower idle targets. Higher utilization on every asset.
Some of that works. Most of it borrows from somewhere else in the operation and pays it back later with interest, in the form of return visits, deferred maintenance, driver turnover, and claims.
The better question is not “how do we get more out of every vehicle?” It is “are our fleet resources being used effectively to support the work this business exists to do?” Sometimes the answer is a routing change. Sometimes it is fewer vehicles, not more work. Sometimes it is discovering that two branches are running the same equipment at 30% utilization and one of them does not need to own any of it. Those are all productivity wins, and none of them involve asking anyone to hurry.
Getting to that answer requires seeing fleet activity and business outcomes in the same view. That is the harder half of the problem, and it is the half that a connected platform is actually for.